ANOVA (Analysis of Variance) is a method used to compare the means of three or more groups to see if at least one mean is different from the others. Let’s go through a step-by-step guide to perform a one-way ANOVA with an example.
Step 1: State the Hypotheses for One-way ANOVA
- Null Hypothesis (H0): The means of all groups are equal.
- Alternative Hypothesis (Ha): At least one group mean is different from the others.
Step 2: Choose a Significance Level
- Commonly, a 5% level (0.05) is used.
Step 3: Gather Data
You need data from each group you’re comparing. For example, let’s say we’re comparing test scores from three different teaching methods, with scores for each method as follows:
| Method 1 | Method 2 | Method 3 |
| 80 | 78 | 90 |
| 85 | 82 | 92 |
| 88 | 80 | 91 |
Step 4: Calculate Group Means and Overall Mean
Mean of Method 1 =
ȳ_{1} =\dfrac{80+85+88}{3} = 84.33Mean of Method 2 =
ȳ_{2} =\dfrac{78+82+80}{3} = 80.00Mean of Method 3 =
ȳ_{3} =\dfrac{90+92+91}{3} = 91.00Overall Mean =
ȳ =\dfrac{80+85+88+78+82+80+90+92+91}{9} = 85.22Step 5: Calculate the Sum of Squares Between Groups (SSB)
First, the equation for SSB = Σ nᵢ(ȳᵢ – ȳ)²,
where:
nᵢ is the number of scores in each group (in this case is the method),
ȳᵢ is the mean of each group, and
ȳ is the overall mean.
Second, the calculation of SSB for our data =
3*(84.33-85.22)² + 3*(80.00-85.22)² + 3*(91.00-85.22)² = 183.22
Step 6: Calculate the Sum of Squares Within Groups (SSW)
SSW = Σ (yᵢj – ȳᵢ)²,
where:
yᵢj is each individual score and
ȳᵢ is the mean of that score’s group.
SSW for our data =
 (80 - 84.33)² + (85 - 84.33)² + (88 - 84.33)² + \\
(78 - 80)² + (82 - 80)² + (80 - 80)² + (90 - 91)² + \\
 (92 - 91)² + (91 - 91)² = 59.33
Step 7: Calculate Degrees of Freedom
DF Between = Number of groups – 1 =
3 - 1 = 2
DF Within = Total number of observations – Number of groups =
9 - 3 = 6
Step 8: Calculate the Mean Square Values
Mean Square Between (MSB) =
\dfrac{SSB}{ DF Between} = \dfrac{183.22}{2} = 91.61Mean Square Within (MSW) =
\dfrac{SSW}{ DF Within} = \dfrac{59.33}{6} = 9.89Step 9: Calculate the F-Statistic
The F-statistic in our example is crucial for determining whether the differences in test scores across three teaching methods are statistically significant, guiding educational decisions and research.
F_{stats}= \dfrac{MSB}{MSW} = \dfrac{91.61}{9.89} = 9.27Step 10: Compare F-Statistic to Critical Value
From above calculation, the F-statistic was 9.27. The degrees of freedom for the numerator (between groups) is the number of groups minus one, which is 2 (since we have 3 groups), and for the denominator (within groups), it’s the total number of observations minus the number of groups, which is 6 (9 total observations – 3 groups).
Now, let’s find the critical value:
- Degrees of Freedom (numerator, between groups) = 3 – 1= 2
- Degrees of Freedom (denominator, within groups) = 9 – 3 = 6
- Significance level (commonly used) = 0.05
You would normally use an F-distribution table in the statistical book or in this link: (F-distribution table). Find the critical value for these degrees of freedom at a 0.05 significance level which is as following:
F_{critical} = 5.1433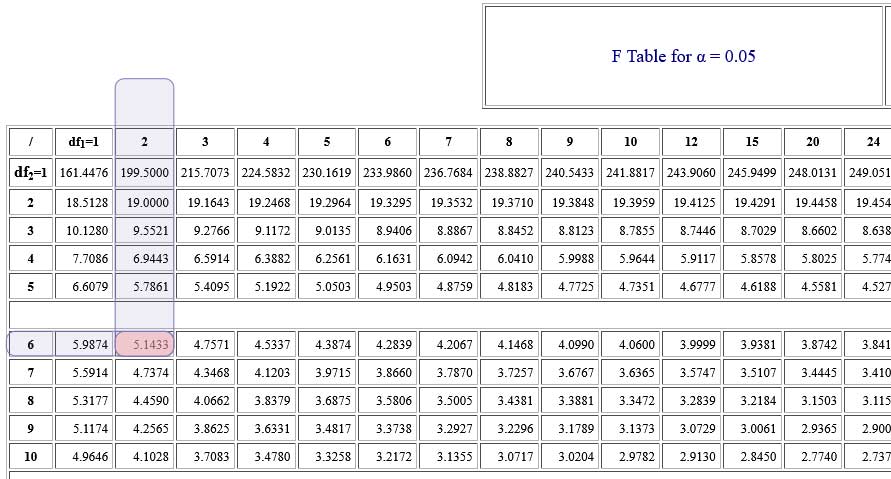
Comparison Process:
- Look up the critical value for DF1 = 2, DF2 = 6 at the 0.05 significance level in an F-distribution table.
- Compare the critical value to our calculated F-statistic (9.27).
- If the F-statistic is greater than the critical value, you reject the null hypothesis, indicating a significant difference in group means.
5.1433 < 9.27 \\ F_{critical} < F_{stats}Conclusion
- In our example, since the critical value at a 0.05 significance level for DF Between = 2 and DF Within = 6 is less than 9.27, we can reject the null hypothesis, suggesting that the teaching methods have significantly different effects on test scores.